
James Miller G3RUH
In early 2009 we received a joint invitation from NASA and the NOAA Space Weather Prediction Center (SWPC) to partner others in downloading space weather data from the Stereo spacecraft on a "best effort" basis. This has required the development of hardware and software, remote control and dealing with the problems of keeping a system running around the clock. We considered, and find, the experience to be valuable training for advanced Amsat operations. This article describes what we did.
Figure 1. Orbits of Stereo-A and Stereo-B. Launched in 2006 Oct, both were then slowly moving around the path in the direction away from Earth, -A anti-clockwise, -B clockwise. In 2011 Feb they were opposite one other, and in 2015 Jul-Nov behind the Sun. As of 2016 both spacecraft are approaching Earth for an encounter around year 2024. Note: On 2014 Oct 01 Stereo-B has went out of commission and recovery efforts continue.
NASA's STEREO spacecraft are two space-based observatories - one moving ahead of Earth in its orbit, the other trailing behind. With this pair of viewpoints, you can see the structure and evolution of solar active regions as they rotate with the sun, and storms as they shoot from the Sun and move out through space to sometimes intersect the Earth. You can read much more about the STEREO spacecraft on the NASA STEREO website [1].
Data is transmitted from STEREO in one of two modes; (a) high speed (currently 720 kbps), stored data (up to 1 Gb), intended for the Deep Space Network (DSN) to collect the high resolution science data some 8 hours/day, and (b) a low speed 633 bps continuous real time subset of the solar data intended for collection by smaller ground stations. Amsat collects low speed data. The ground stations then forward the data via the Internet to NASA GSFC for processing where it is posted on the web [2] in near real time for all to use, including the various world wide organizations monitoring and predicting Space Weather. The ground network for the low speed data is organized and coordinated by the SWPC in Boulder, Colorado.
The spacecraft transmit 63 watts to a 1.1m dish at 8.4 GHz RHCP, an e.i.r.p. of approximately 85 dBm. The range at present (2013 Dec) is about 290M km, increasing very slowly to 300M km in 2015.
 * Data Rate:        633.245  bps
 * Symbol rate:     3799.472  sym/s
 * Bytes per block: 1119      bytes  incl. crc and sync
 * Bits/block:      8952      bits
 * Symbols/block:   53712     sym
 * Block period:    14.137    s
Note: In 2013 April the <15,1/6> convolutional encoding changed to <8920,1/6> Turbocode encoding; this brings an additional gain of 2.2 dB to the demodulation process.
The smaller than ±π/2; modulation index means that there is substantial residual carrier. At Bochum the received residual carrier to noise ratio CNRr is (2011 Dec) typically 40 dB in a 1 Hz bandwidth, or about 20 dB in an CW bandwidth, very strong in a loudspeaker.
Figure 2. System block diagram. Shows the flow of information through the equipment at Bochum from antenna to NASA.
The receive process begins at the antenna focus with an OK1DFC RHCP/LHCP septum polariser and feedhorn by ON6UG, an 8.4 GHz preamplifier and downconverter from Kuhne Electronic, DB6NT. The IF is 1270 MHz, and in the control room is connected to an AOR AR5000 general coverage receiver.
Its 10.7 MHz IF signal is then downconverted to 38.4 kHz, a convenient IF for the demodulation system.
The Data Demodulator accepts the 38.4 kHz IF, phase locks onto the carrier, demodulates the data (3.8 ksym/s) which passes to the Decoder computer.
The Decoder computer takes in the very noisy symbol stream via a soundcard, extracts the data frames and forwards them every 14.1s to NASA via the internet.
The entire process is automatic and operates unattended.
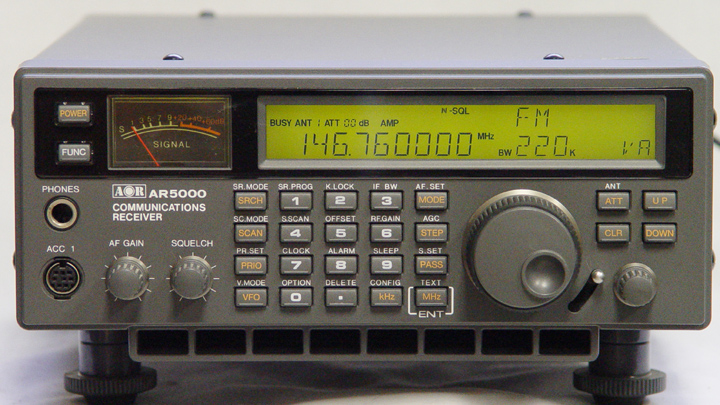
Figure 3. The versatile AOR AR5000 general coverage receiver, sadly no longer in production, but still available second hand.
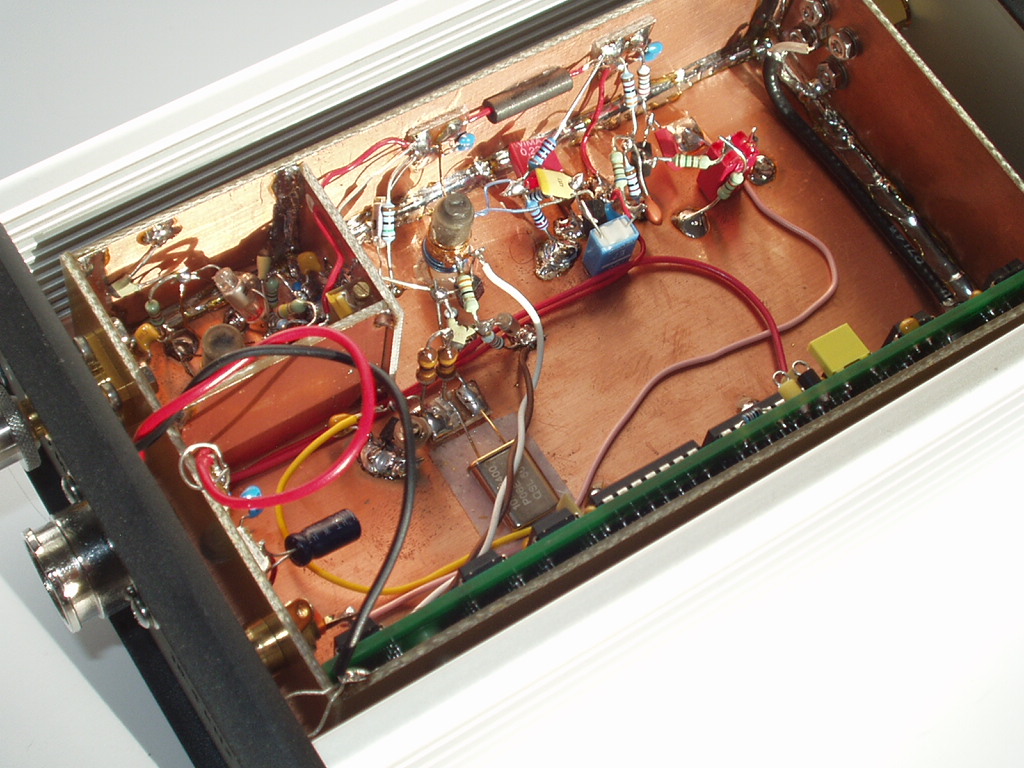
Figure 4. Inside the 10.7 MHz to 38.4 kHz downconverter unit. Input is at the top-left, output bottom-left. Green PCB is the optional local oscillator frequency synthesiser; 10 MHz reference input top-right.
Figure 5. Schematic of the 10.7 MHz to 38.4 kHz downconverter by DJ4ZC.
Figure 6. Schematic of 10.738636 MHz frequency synthesiser by G3RUH.
 * Automatic selection of Stereo-A or Stereo-B
 * Calculating the main doppler shift
 * Phase demodulator PLL monitor
 * Reading an ADC and computing data spectrum
 * Acquisition of spacecraft carrier and fine tuning
 * Sending the desired frequency to the AR5000 receiver
 * Reporting status to remote internet user
The AR5000 receiver is operated in CW mode, IF bandwidth 30 kHz, with AGC OFF. The control software sets these conditions automatically.
An operator can login to the computer via the internet and monitor the program status, as well as control its operation. Software and other files can also be updated.
A typical screenshot is shown below; see caption for description.
Figure 7. Screenshot of radio tuning computer software. The top shows the usual tracking information, the bottom part is an almanac of target spacecraft. The graphic shows Stereo-B's data spectrum. The total bandwidth displayed is 30 kHz and the vertical is 10 db/div. The spectrum is a smoothed average with a time constant of 20s, equivalent to a "video low pass filter" of 0.01 Hz; this reduces the display noisiness. The spectrum can also be downloaded for remote analysis. A Help screen is an alternative to the spectrum graphic.
Either 1. Rapid (almost instantaneous) acquisition using spectrum analysis. The 38.4 kHz IF signal is sampled at 167 ksample/s and an 8192 point FFT gives a spectrum at 20 Hz resolution. If a 'strong' carrier is detected, the radio is tuned to its frequency.
Or, 2. A sawtooth frequency search is layered over the continuous doppler shift until demodulator carrier LOCK is detected.
In both cases, if carrier LOCK is acquired for 5s continuously, the demodulator's frequency HI/LO status is checked to fine tune the radio. If LOCK is lost for more than 5s, search/acquisition resumes.
During that time signals became weaker as the range increased, and it was apparent that a dedicated phase demodulator was required for the future. This item was designed by the author and is in permanent use. Schematic (Fig. 8), PCB (Fig. 9), Unit (Fig. 10). The design was made quite general so that we could experiment with centre frequencies, filters and PLL loop bandwidths until the most suitable configuration was found. Briefly, it includes:
 * Input x1 - x10 amplifier
 * Digital Phase lock loop to recover 38.4 kHz carrier
 * External selection of PLL bandwidth via RS-232
 * Phase detector
 * Output low pass filter, 16 kHz
 * Output driver, transformer isolated
 * LED indicators (PLL High, Low, Locked)
 * Centre tuning meter
 * LED status output via RS-232
 * Power regulation
Figure 8. Schematic of Stereo Data Phase Demodulator. This takes the Stereo signal on a 38.4 kHz carrier and delivers a 3.8 ksym/s stream to the decoding computer. Larger (opens in a new window).
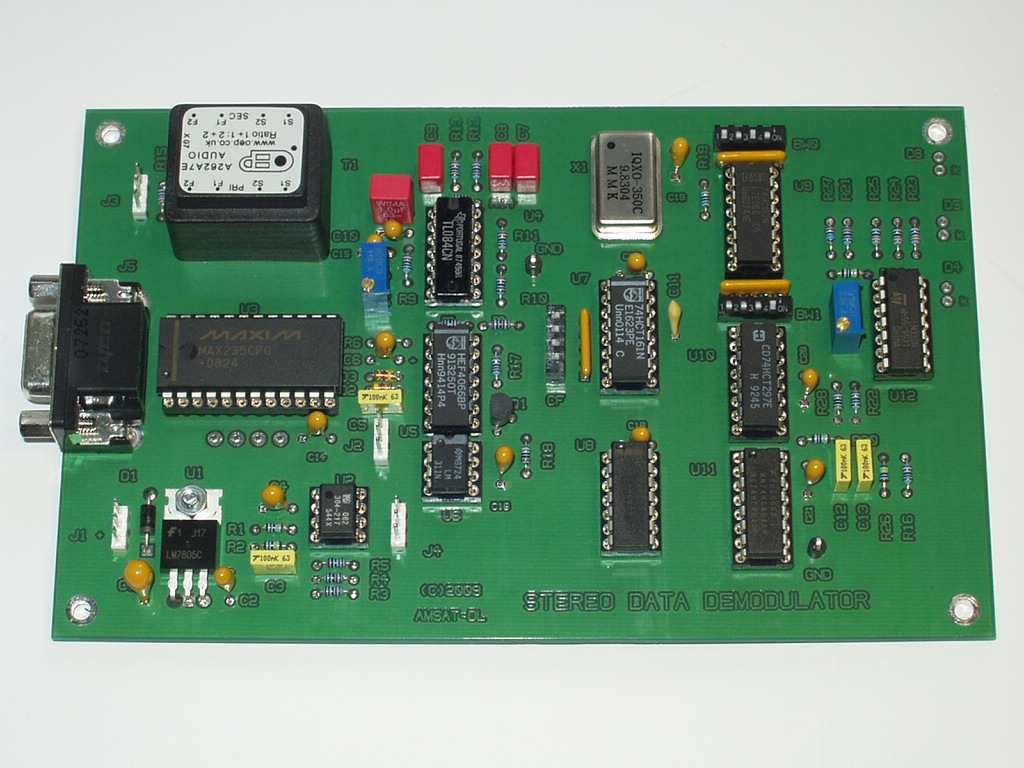
Figure 9. Phase Demodulator PCB. The design was made quite general so that we could experiment with centre frequencies, filters and PLL loop bandwidths until the most suitable configuration was found. The final result has some components omitted, and some added.
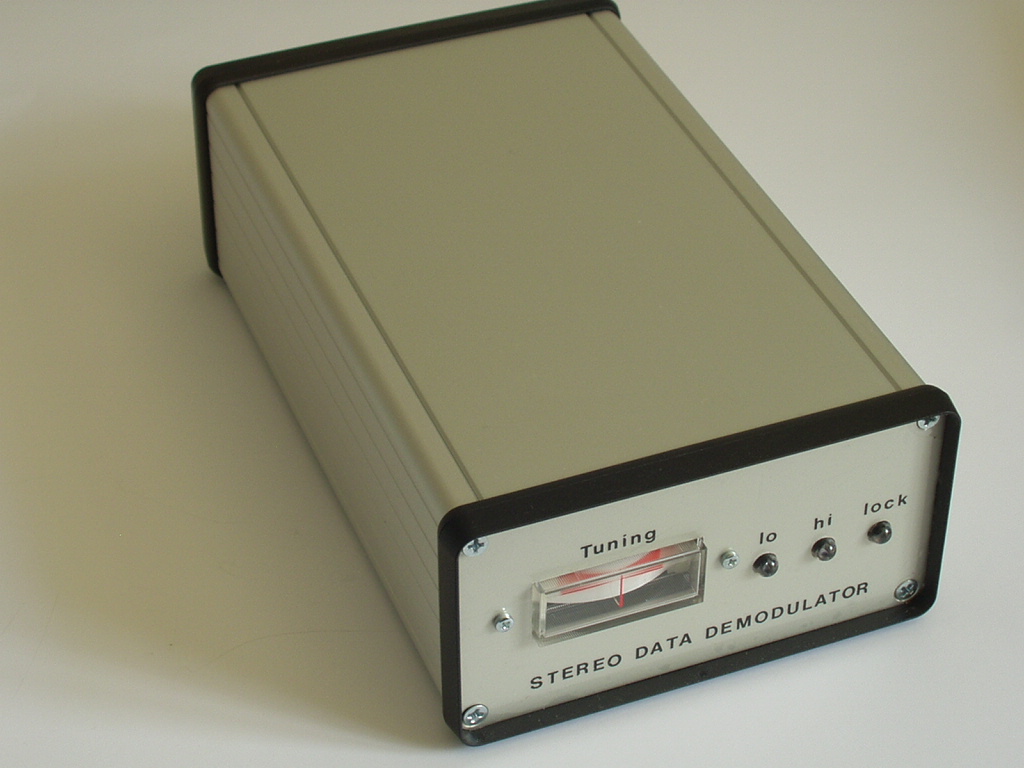
Figure 10. Completed Stereo Data Demodulator. The LEDs show when the input frequency is high or low, complemented by the analogue meter. The Lock LED shows when the PLL is locked to a carrier. These conditions can also be read by a computer via the RS-232 port.
The phase demodulator delivers a 3800 sym/s stream to the decoding computer. Due to the x6 convolutional/turbo-code (1 bit becomes 6 symbols) this signal is very noisy and virtually impossible to see on an oscilloscope. But with a loop bandwidth of 19 Hz (one-sided), the carrier loop signal-to-noise ratio is in the region 25 dB and tracking phase jitter is small.
 * Service a soundcard at 48000 sample/s
 * Search for sync vector
 * Extract the 3800 Hz symbol clock
 * Remove the clock from the symbol stream
 * Integrate-and-dump the symbols
 * Viterbi <15,1/6> convolutional decoder
 * Un-randomise the data
 * Block framing and CRCC validatation
 * Send valid blocks to NASA
 * Report diagnostics
The program runs under Linux (Ubuntu 8.04.2) on an industrial rack-mounted i686 PC. The major parts of the program, i.e. the symbol and frame synchronizer, and the Viterbi convolutional decoder, were written and donated to NOAA for this purpose by Phil Karn KA9Q, well known for work on Forward Error Correction FEC for Amsat. [3].
The expected error performance of a <15,1/6> system using a Viterbi convolutional decoder can be found by Monte Carlo simulation using thousands of trials. The Error Rate vs Eb/No is shown in Fig. 11.
Figure 11. Illustrating the communication performance gained using a K=15, R=1/6 convolutional code with 8920 bit blocks, compared with uncoded data. Also shown is the frame error rate of an <8920,1/6> Turbocode, which shows a further 2 dB improvement. Convolutional data points by simulation; Turbocode data points from NASA/JPL DSN Telecommunications Link Design Handbook 810-005, section 207.
Errors tend to come in bursts, rather than isolated bits at random, but here a single error invalidates an entire block. So a metric more relevant to the Stereo A/B application is Block (frame) error rate. Some values for <15,1/6> convolutional encoding:
          Block     Symbol
 Eb/No    Errors    Errors
  dB        %         %            Comment
 -----------------------------------------------------
 0.00      100       28.2       Useless
 0.75       50       26.5
 2.10       ~0       23.1       Essentially error-free
 -----------------------------------------------------
Thus the threshold between 'perfect' and 'useless' signal is only 2 dB. With a Turbocode, the 'cliff' is even steeper; less than 0.5 dB.
The Turbocode decoder, introduced in 2013 April, was implemented by Mario Lorenz DL5MLO. Its tasks are:
 * Service a soundcard at 48000 sample/s
 * Search for sync vector
 * Extract the 3800 Hz symbol clock
 * Remove the clock from the symbol stream
 * Integrate-and-dump the symbols
 * Un-randomise the data
 * Estimate SNR / Normalize data
 * Run Turbo Decoder (8920, R = 1/6), up to 20 Iterations
 * CRC Validation (stops decoding if CRC matches)
 * Send valid blocks to NASA
 * Report diagnostics
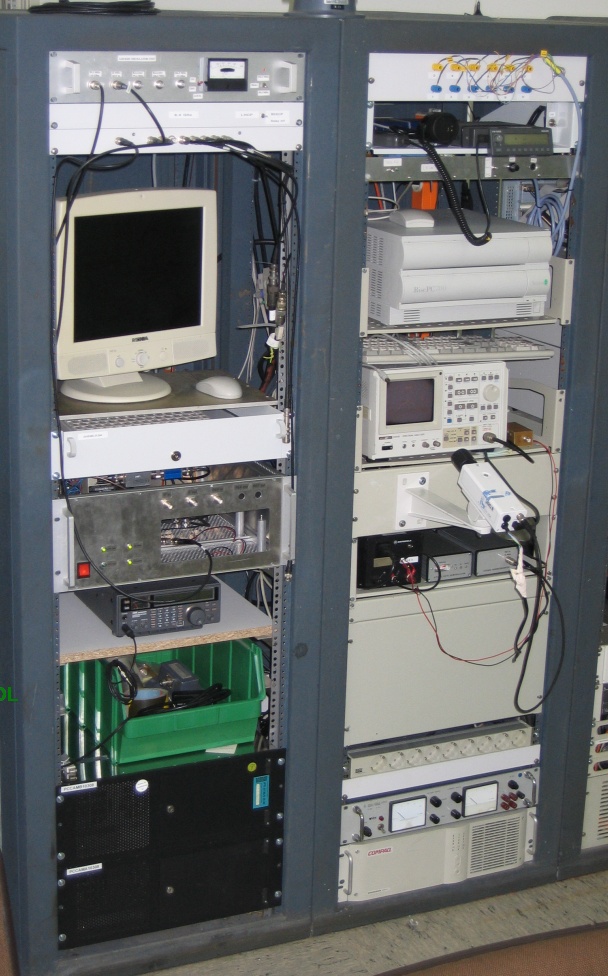
Figure 15. Instrumentation racks in control room. Rack 1. 8.4 GHz downconverter local oscillator synthesiser; 10 MHz reference distribution amplifier; screen & keyboard for computers; Rubidium 10 MHz frequency standard/GPS receiver/radio module; AR5000 receiver (temporarily removed from above); recycling bin; Stereo decoding computer (BoST, Linux Ubuntu 8.04.2); spare computer (BoWN, Windows). Rack 2. S-band transmitter interface; 70cm FM radio; Stereo tuning and demodulator control computer (BoCR, Acorn RiscOS); Advantest R4131 spectrum analyser and webcam; Stereo data demodulator, IF Downconverter and PSU; uninterruptible power supplies. Rack 3 (not shown) contains the network management computer/gateway (Unix FreeBSD 4.10) and ethernet distribution.
The downloads actually achieved by all stations can always be found at [4], which is continuously updated, and is typified by Fig. 12.
Figure 12. Total live download performance chart from NASA [4]. As of 2016 stations at Bochum, Germany DK0SB (20m), Kiel-Ronne, Germany DL0SHF (7m), CNES Toulouse, France (9m), NICT Kogenei, Japan (11m) and KSWC Jeju Is., South Korea (15m) are contributing data. When the Deep Space Network (DSN 34m) are downloading, partner stations' reception stops although the real time data flow to GSFC is maintained as part of the downloaded high speed data stream. Current chart (opens in a new window)
Every data block sent to NASA is temporarily stored locally, so at the end of the day a directory listing from the decoding computer can be downloaded and the file timestamps provide a record of what was gathered. A plot can be made of this, and an example is Fig. 13. Each dot represents a data block.
Figure 13. Typical daily download of data. Each dot represents a block. In this plot, Stereo-A rises at about 0207 utc; carrier PLL lock is immediate, but signals are too weak to decode until clear of the horizon obstructions at 0220 utc and elevation = 2�. Decoding continues unbroken until 1110 utc when Stereo-A switches to Deep Space Network (DSN) mode, so the author has manually changed the system to receive to Stereo-B. The gap of 3 minutes is when the antenna slews to the new spacecraft, and decoding of Stereo-B begins. This continues until 1845 utc, when the DSN again take over with their high speed system. You can compare this operation with the first part of the NASA chart, Fig. 12.
Figure 14. Stereo-B signal spectrum, remotely downloaded for analysis. White dots and lines on the plot show where power measurements are made, leading to the estimates at the top of the plot. Here the Eb/No is estimated to be 15.5 dB, which corresponds to a Symbol Error Rate of under 0.1%, a normal strong signal. Checking these data is important, as it quickly allows the system performance to be monitored for problems.
Here the Eb/No is estimated to be 15.5 dB, which corresponds to a Symbol Error Rate well under 0.1% ; the errors are removed by the convolutional decoder. The threshold is about Eb/No = 2.0 dB, when the Symbol error rate is about 23% at which point decoding begins to fail. [2013] With Turbocoded data, the threshold is about Eb/No = 0.0 dB.
Thus, under good conditions there is a performance margin of 13 to 15 dB. This is eroded several dB by rain, and in serious storms decoding can cease, but this is rare.
In 2015, the spacecraft will be behind the Sun (April-June), with a high noisefloor and scintillation, so conditions will be challenging for everybody. This is acknowledged by the NASA/NOAA Stereo team, with who we are in regular discusssion.
To help meet these challenges, NASA/NOAA plan to change the modulation index from 0.6 radian to 0.83 radian, which puts 2.3 dB more power into the data, and 1.7 dB less into the carrier. [Implemented 2010 Oct]. The first of these improves the Eb/No, whereas the latter degrades the PLL tracking noise slightly. In addition, Turbocoding will be introduced. [Implemented 2013 April]. Together these changes improved the downlink by 4.5 dB.
As a result of our recent and future developments, we will continue to deliver even under those worst-case circumstances, 2015 April-June excepted when nobody can, or when there are severe rain storms.
Thus from home we are able to make very accurate measurements of beam pattern using Stereo-A/B's (and other) spaceborne beacons and so investigate the antenna gain in fine detail.
Moon and calibration star noise power measurements are much easier to perform at length and without distractions, especially at unsocial hours. This work continues to improve our understanding of the antenna performance.
The dish is being operated at 4x the original design frequency, and no performance data was originally available to us. It has taken our small engineering team several years to get to this point, yet there are lots of new challenges for the amateur still to be tackled.
4. Daily Stereo Beacon Summary
Feedback on these pages to Webmaster. Feedback on the article should be sent to James Miller
Page created: 2010 Aug 09 -- Last modified: 2023 Apr 14 [ URLs ]