
James Miller G3RUH
Soon after launch Amsat will fire the on-board rocket at apogee in order to raise perigee height, and possibly alter the inclination.
Now the problem begins. What are our new orbital elements? We know more or less what they ought to be, and that will do for rough tracking for a day or two. But we really need to re-compute P3D's new elements right away, especially if there has been any problem with the burn.
But why cannot we simply get the new elements from NORAD? The answer is that they won't have them. If we change the satellite's orbit at apogee, P3D will come around the Earth at perigee totally out of position as far as NORAD are concerned. They will fail to acquire P3D with their tracking systems. That is to say, they will lose us. It is up to Amsat to tell NORAD where we are again.
So it is important that we have a totally independent ranging system for P3D, just as it was for Oscar-13, Oscar-10 and P3A before.

Figure 1. In principle, 6 range measurements enable computation of six orbital elements, such as the set <Rx,Ry,Rz,Vx,Vy,Vz> or <a,i,e,ma,wp,ra> at epoch. In practice many more measurments are made to reduce the effects of noise and poor geometry.
Obviously you cannot determine the orbit from just one range. You have to make a number of measurements at different times through the orbit, on different orbits, and on orbits when the view varies, such as to the East or West or equally take ranges from different stations scattered around the world.
By collecting maybe a couple of dozen time and range pairs, spread over say 5 days, one has enough raw data to determine the orbital elements with sufficient accuracy to perform normal tracking again.

Figure 2. Ranging is based on measuring the round-trip-time of a pulse transmitted to the satellite and received back on the ground. Overlapping returns place a limit on performance.
Notice several things about a single returned pulse. First; only the leading and trailing edges carry timing information. So a longer pulse simply wastes interim power that could perhaps be put to better use. Second, due to the audio channel bandwidth, the shortest practical pulse duration is of order 1/Bandwidth. Third, the maximum repeat rate is set by the round-trip-time. Send any faster, and the returned pulses overlap, creating ambiguity.
So, though simple, the single pulse approach has limitations. Ideally we would like to send pulses continuously. This would provide a continuous supply of timing edges; so we would be making the most of the available power and channel bandwidth. The overlap ambiguity caused by repeated identical pulses is simply resolved by encoding the bit stream into a sufficiently long repeated message.

Figure 3. A longer pulse can be broken into a sequence of short pulses. By proper choice of the sequence, overlapping returns can be distinguished, and transmission is continuous.
Here, for clarity, is a coded sequence 1010011, 7 elements long. You can see how the delayed return sequence can be identified, giving the desired measure of range.

Figure 4. Searching the received sequence for the pattern 1010011 by sliding a local replica along the received signal. This is correlation.
Searching the received sequence for the pattern 1010011 is done by comparing the received stream with a local replica. The replica is "slid" along the received pattern looking for maximum agreement, or correlation.
Here you can see that if received data and local replica are aligned, there are 7 matches, and no mismatches, a "score" of 7. If the replica is now slid along one unit of time, the score falls away to near zero.

Figure 5. The complete graph of score versus alignment shows peaks of 7 corresponding to alignment, and the fall to -1 with misalignment. An erroneous received bit has negligible effect on the peak.
Plotting the complete graph of score versus alignment shows the peak of 7 corresponding to alignment, and the fall to -1 with misalignment.
The strength of this technique is its tolerance to errors. Suppose one received bit is corrupted; then the score will fall to 5, which is still very distinct from the baseline -1.
Of course the peculiar property of negligible self-correlation when more than one bit out of alignment is no accident. The sequence is one of a family of maximal length pseudo-random number (PRN) sequences, and is exactly 2n - 1 elements long. Here n=3. It can be created by software or hardware from an n-bit shift register with its output exclusive-ored with one or more intermediate stages and fed back to the register's input. This is called a linear feedback shift register (LFSR), and forms the foundation of many digital communication systems, such as the Global Positioning System, data scrambling, wireless LANs, pagers, spread spectrum systems, radar and as here, ranging,
The bit rate is chosen to be 400 bps. Now 400 x 1/3 = 133 bits; choosing the power of 2 just larger gives code length of 28 - 1 = 255 bits. This repeats every 0.64 seconds, offering a maximum range of 96,000 km. Coarse resolution, 1 bit, is 375 km, and the 400 bps bit timing can be resolved to about 200 ns (30m).

Figure 6. Typical P3 ranging system. P3D will probably use 1.3/2.4 GHz to reduce ionospheric delay effects.
400 bps is used for two important reasons. First, hardware; something is needed to create uplink bits and decode them from the downlink. It already exists as the P3 command uplink modulator and P3 PSK telemetry downlink demodulator [1]. They run at at 400 bps.
Second, the discussion so far assumed that the spacecraft's transponder would be turned on to return an echo. But that will not necessarily be the case. So how do we get an echo if there's no transponder? Well, the P3 flight computer has an echo mode. The uplinked bit stream is demodulated by the command system, and re-modulated onto the telemetry beacon, so providing a simple digital transponder.

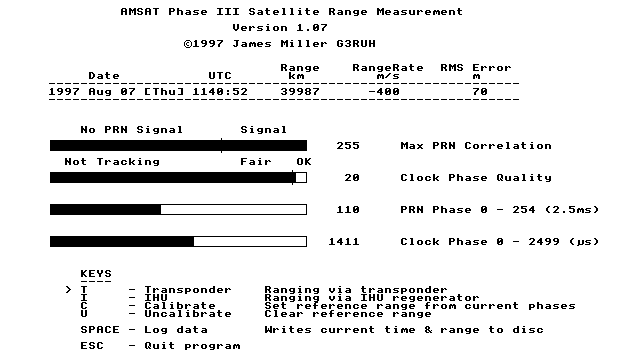
Figure 7. Live screenshot ranging via the Oscar-10 mode-B transponder. Station is at 0.057°E, 52.208°N.
The screenshot shows a live ranging session via Oscar-10's transponder It shows twinkling numbers and four slider bars. The first of these shows that perfect bit detection is being achieved, whilst the second indicates that bit lock has low jitter.
The last two sliders show the relative phase of received signal compared with transmitted signal. It's 110 + 1411/2500 = 110.5644 bits or 0.276411 seconds which equates to a range distance of 41,433 km. From this the software has subtracted out the static delay due to hardware of 1446 km to give the displayed actual range of 39987 km.
The raw timing data arrives at 400 measurements/s, and is noisy (jittery) partly due to hardware, but mainly due to radio propagation. This timing information is processed by a second order filter which yields range, range-rate and an indication of accuracy. The filter noise equivalent bandwidth is 0.3 Hz.
With a 255 bit sequence, the error rate can be very high. Statistically, a match of at least 170 agreements is certain to indicate that a ranging signal is being received. That implies 85 bit errors, or a 1 in 6 bit error rate (allowing for the differential modulation format). This in turn corresponds to an Eb/No = -3 db. That's a signal strength some 20x weaker (-13 db) than the weakest one would used for normal telemetry. Thus ranging is perfectly possible despite the signal being virtually inaudible. This high sensitivity is important because during manoeuvres the spacecraft's attitude is rarely benign enough to point its antennas at Earth.
         Source                  RMS (m)
   -------------------------------------
   Modulator+Demodulator+Software    10
   Radio TX + RX (local signals)     30
   Propagation (strong signals)      50
       ..      (weakest signals)    350
   -------------------------------------
Static instrumentation errors (biases) are calibrated out, leaving only propagation effects, mainly caused by ionospheric delay variations. Typical zenith errors at 145 MHz are 0.4 km by night, 2 km by day depending on the total integrated electron count over the ray path. These values are doubled at 30° elevation, and typically tripled at the horizon.
Range residuals based on two week's ranging AO-10 (mostly at elevations less than 30°, are typically 5 km RMS. However a plot of fitted range error vs elevation clearly shows the residual errors to be biased.
To some extent this bias can be removed by modelling, leaving worst case residual bias uncertainties of order 0.5 km. However since these errors reduce as (1/f)2 a better approach would be to reduce them 100-fold by using radio links at L and S-bands. [2,3]
In any event, the range biases are small in the context of the orbit determination program to which range measurements are subsequently delivered.
The number-crunching principle used is the same as with all navigation or estimation systems.
You start with a guess at the orbit, and calculate the expected ranges at each of the times you made the measurements. Then you compare the measured ranges with the expected ranges, and the small differences are used to adjust the orbital elements slightly to produce a new set of elements. The process is repeated until the elements don't change any more. Finally the new elements are output in various styles, such as the familiar 2-line format.
The table shows four sets of keplerian elements. The first set (1) were provided by NORAD soon after launch. The planned first motor burn of delta-V = 136 m/s along direction Alon 75 Alat -55, Orbit 16 @ MA 180 was added to it to generate a predicted element set for post-burn (2).
After the burn had taken place, command stations in Germany, Australia and New Zealand performed a total of 20 range measurements over the next five days. These ranges were then run through the OrbitFit program which generated the third set of data (3). This set was was then passed to NORAD and they immediately acquired AO-13 and provided a final set of data (4) which, for this table, has been worked backwards to match the epoch time of the third set.
Comparing the set calculated by Amsat Ranging (3), and the set (4) subsequently obtained from NORAD, shows excellent agreement.
Comparing Range and velocities versus time using set (1) and set (4) shows that they intersect at Day 1988/174 T=1857 utc. The difference in velocities at that moment is a delta-V of 150 m/s along a direction Alon=75. 1, Alat=-56.2. That attitude compares well with the pre-burn attitude estimate made using the on-board Sun and Earth sensors. The increased delta-V was due to programming a burn of longer duration than advertised. This information was also used to calibrate the motor thrust.
                        (1)           (2)            (3)             (4)
                    Post Launch    Post Burn      Post Burn      Post Burn
                      NORAD        Predicted     After Ranging     NORAD
 --------------------------------------------------------------------------
 Epoch time:        88171.24031   88174.78919    88174.78919    88174.78919
 Inclination:            9.9753     13.796394        14.1441        14.3010
 RA of node:           243.3977      243.0702       242.8089       243.2583
 Eccentricity:        0.7303521     0.7028709      0.7014365      0.7012999
 Arg of perigee:       181.1498      183.1604       183.4078       183.0315
 Mean anomaly:       174.981788     178.80542       178.1484       178.1585
 Mean motion:         2.2581620     2.2050733     2.20044346     2.20041400
 Epoch rev:                   8            16             16             16
 Semi major axis:     24546.726     24938.175      24973.083      24973.177
 --------------------------------------------------------------------------
2. Spilker, J.J., GPS Signal Structure and Performance Characteristics, Journal of the Institute of Navigation (USA), Vol. 25 No. 2, 1978.
3. Spilker, J.J., Digital Communications by Satellite, Prentice Hall, 1977
4. Meinzer, K., Range Measurements with OSCAR-6, QST May 1973.
5. Acorn Risc Computer [ 2023 update; only second-hand machines nowadays! ]
Feedback on these pages to Webmaster. Feedback on the article should be sent to James Miller
Created: 1995 Jan 15 -- Last modified: 2023 Apr 23